Pitch Deck Design Agency
The Industrial Automation / Robotics Investment Deck: When the Payback Math Has to Do All the Heavy Lifting
A Presentation Gurus breakdown: how to build a winning Supply Chain, Manufacturing & Industrial Decks pitch.
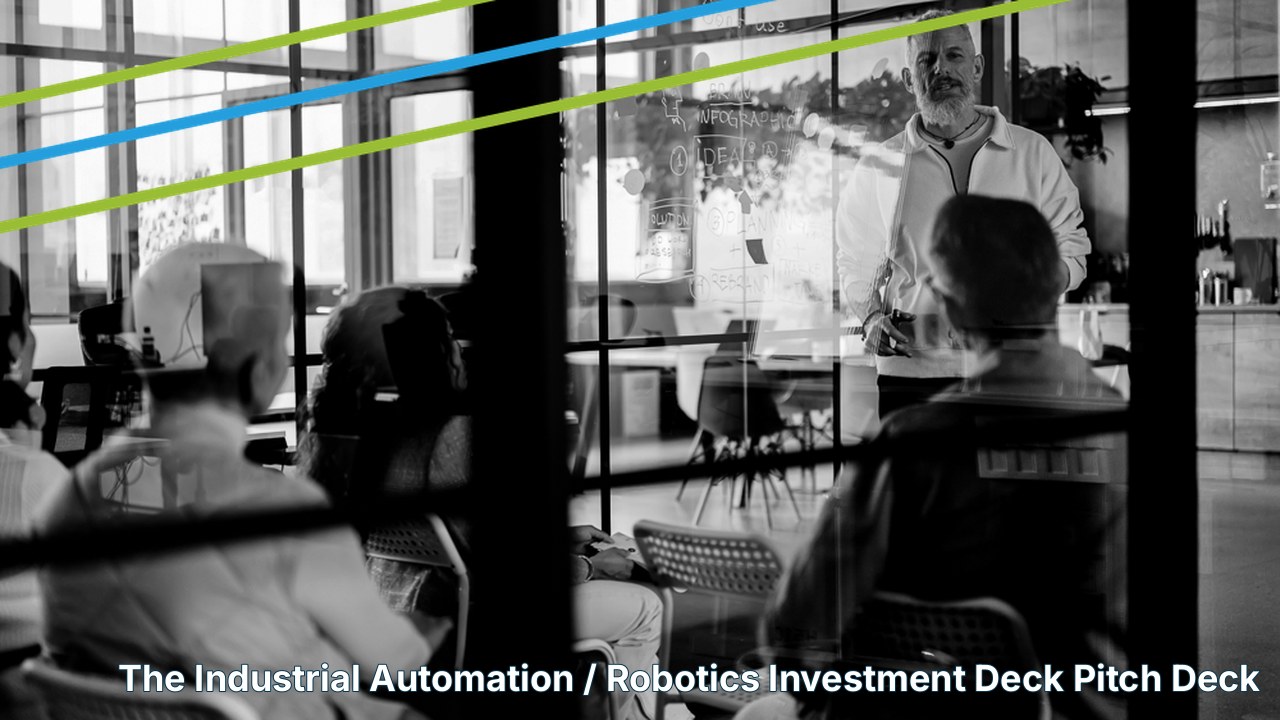
Presentation Gurus — Pitch Deck Breakdown: The Industrial Automation / Robotics Investment Deck
Highlight
- This deck type fails not when the ROI is weak, but when the payback logic ignores the specific audience’s risk floor — a plant manager’s lived experience of what breaks down on a line versus a CFO’s spreadsheet tolerance for variance.
- The real competitor in this pitch is not another robot vendor; it’s the decision to keep the current line running with overtime, and that counterfactual must be rendered with enough granularity to make complacency feel expensive.
- Labor-cost comparisons are table stakes; the variable that closes the deal is the per-unit cost floor under different utilization scenarios, stress-tested against a single-shift break.
- A robotics investment pitch that leads with technology often loses to one that leads with a specific production bottleneck that everyone in the room already knows by name and cost.
- The narrative shape that works here is a capital project arc, not a fundraising pitch — the audience expects a structured IRR with maintenance and retooling assumptions, not a growth curve.
Presentation Design Process
Four Steps, One Simple Process
This is a straightforward, side-by-side collaboration designed to remove all the traditional complexity from the process. We work together seamlessly via Microsoft Teams or your preferred online platform, sharing our screens to review layout, story, and graphics in real time. This allows us to capture your immediate feedback and make instant adjustments on the spot.
It completely eliminates the old, slow friction of scheduling formal office visits and waiting days for revisions. It is faster, highly convenient, and ensures you get exactly what you need to succeed.
Presentation Discovery
We start by learning exactly who’s in the room, then how you want to use the slide deck, the core message, and the one goal it needs to achieve the moment you finish presenting.
Story & Design
First, we build two custom visual direction slide concepts, matched to the goal of the slide presentation. We also map out the story in a simple, un-styled wireframe. Both are completed side-by-side.
Fast Revisions
Quick morning sprints refine the deck together in real time, getting shorter each round, from a full assembly session down to just minutes, until every slide is locked in.
Full Handoff
After revisions, and when you are 100% satisfied with the presentation, you settle the invoice. You’ll get a fully editable file in PowerPoint, Keynote, or Google Slides, plus a half-hour coaching session so you can present with total confidence.
Ready ToGet Started?
Presentation Gurus is open.
Give us a call.
We actually answer the phone.
The One Question That Kills a Robot Pitch in Under a Minute
The facilities director stares at the throughput projection. The CFO asks one question: ‘What is the real per-unit cost in month seven if we only run one shift?’ It is a simple, fair, almost boring question. And it stops more automation investment decks than any competitor analysis or labor-cost comparison ever will. The reason has nothing to do with the robot’s capabilities and everything to do with how the deck built its payback model — or, more often, failed to.
This deck type carries a specific burden that fundraising decks do not. An investor can tolerate a loosely coupled assumption because they are buying optionality. A procurement committee buying a half-million-dollar robotic arm is buying a fixed cost that will either reduce per-unit overhead or sit idle. The primary concern the decision-maker brings into the room is not ‘can this robot weld faster?’ It is ‘am I about to approve capital that will look indefensible in next quarter’s variance report if the line changes?’
The opening move on this deck is not to dazzle with technology or to recite labor substitution ratios. It is to address that exact operational risk — the cost floor under single-shift conditions — and show you have already accounted for it before the CFO has to ask. That single act of anticipated risk changes the cognitive posture of the entire room. The rest of the deck then becomes an exercise in not breaking the trust earned in the first thirty seconds.
Why This Deck Lives or Dies on Utilization Risk, Not Technical Specs
The external pressures on industrial automation investments have shifted in ways that make the old framing dangerously incomplete. The IRA’s 45X Advanced Manufacturing Production Credit and the Infrastructure Investment and Jobs Act have injected federal dollars into domestic re-shoring projects, which means the payback calculus now competes against subsidized alternatives. A plant in Ohio qualifying for a Manufacturing USA institute can get co-funded automation trials — which creates a new benchmark your payback period must beat, not just a cheaper robot from a competitor.
Simultaneously, the labor market dynamics that drive this pitch are more nuanced than ‘labor is expensive; robots are cheaper.’ The Bureau of Labor Statistics data on manufacturing quit rates shows that churn volatility, not just wage rates, is the real cost driver — and that volatility varies dramatically by MSA. A deck that opens with a national average labor cost comparison is already irrelevant to the plant manager who cannot keep a third-shift team for more than six weeks.
The regulatory layer matters too. OSHA’s lockout/tagout requirements, ANSI/RIA R15.06 safety standards for robot integration, and the growing pressure for Scope 1 and 2 emissions reporting from major OEMs all layer compliance cost and timeline onto any automation investment. The deck that does not show a compliance timeline alongside the payback curve is hiding a real risk that the audience will find anyway — only in their own due diligence, framed by their own legal team.
The Sequence That Closes Industrial Capex: Bottleneck First, Technology Second, Payback Third
A robotics investment deck that follows the standard ‘problem-solution-market-size’ sequence is structurally wrong for this audience. The capital project arc that actually works runs in a different order entirely, because the decision flow of a procurement committee is not the decision flow of a VC.
**First slide: the named bottleneck.** Not ‘labor shortages are rising,’ but ‘the Model 4000 press line in Building 4 loses 22 minutes per shift to manual changeovers, costing $187,000 per month in unplanned downtime.’ The audience needs to see their own factory floor in the slide, not a generic industry trend. If the deck cannot name the specific throughput constraint by machine model and dollar figure, it has not earned the right to propose a solution yet.
**Second slide: the counterfactual in granular detail.** What does the next three years look like with no automation investment? Map the overtime premium growth, the scrap rate creep as manual quality degrades with turnover, and the maintenance escalation on aging equipment the robot would replace. The goal is not to scare the room; it is to make the status quo feel like an active decision with a measurable cost.
**Third slide: the system design and integration.** Here the technology appears, but as a means of solving the bottleneck, not as a product pitch. Show the robot, the cell layout, the interface with existing MES and ERP systems, and the third-party integrator’s track record. This is the slide where credibility is won or lost — if the robotics startup has never integrated with a Siemens PLC in a union shop, do not pretend otherwise.
**Fourth slide: the several-scenario payback model.** Not one payback number, but three: base case (one shift, 80% utilization), upside (two shifts, 90% utilization), and floor (one shift, 60% utilization with a contractual maintenance reserve). The CFO will re-run these scenarios anyway. Pre-empting that work is the single most persuasive move in the deck.
**Final slide: the ask.** Term, total capex, integration timeline, and the trigger conditions — what must be true in month six for the project to continue to Stage 2. Industrial capital committees do not write blank checks; they approve phased gates. Structure the ask that way from the first slide.
When the Payback Model Is Too Complex for a Single Spreadsheet Tab
The craft challenge with industrial automation decks is not storytelling; it is compression. A credible payback model for a robotic cell involves component-level pricing, installation labor, integration testing, retooling inventory, scrapped parts during ramp-up, and the probability of a line rebalance that shifts the robot’s utilization from 80% to 40% in month nine. That is six to eight variables minimum, each with a distribution, not a point estimate. Building a slide that communicates the rigor of that model without asking the audience to read a spreadsheet is a distinct skill from building a venture deck or a commercial proposal.
This is where a specialized editorial and design partner becomes valuable not as a convenience but as a structural necessity. A team that has modeled dozens of industrial capex cases knows that the denominator on the payback period changes at different utilization levels and that the ROI slide must reconcile with the project timeline slide to the decimal. They also know that the deck’s flow must shift depending on whether the audience is the plant manager’s capital committee, the board of a family-owned manufacturer, or the investment committee of a private equity firm evaluating a bolt-on acquisition of an automation startup.
At Presentation Gurus, we build these models in locked spreadsheets that the client’s internal FP&A team can verify, then translate the output into visual sequences that let the decision-maker trace the assumptions without reading a single formula. The payoff is that the deck survives the ‘show me the model’ moment — the one that kills the cheap competitor every time.
Why This Deck Follows a Capital Project Arc, Not a Fundraising Pitch
The audience for an industrial automation investment deck reviews slides the way an operator scans an alarm panel — searching immediately for the single number that is out of tolerance. Their attention is a scarce resource that must be preserved for critical decisions, not spent on narrative flourishes. That is why the capital project arc works here when a venture-style ‘market problem / unique solution / traction’ sequence would not.
A capital project arc is organized around a single question: ‘What is the expected return on this specific deployment, and what are the conditions under which that return changes?’ The audience’s mental model is approval gate, not curiosity. They do not ask ‘could this be big someday?’ They ask ‘will this beat our internal hurdle rate of 15% with a payback under 24 months?’ The deck’s structure must map directly to that capital allocation process.
Concretely, this means the deck de-emphasizes things that a VC deck leads with — market size, team backgrounds, competitive positioning — and foregrounds things a VC deck often buries: maintenance costs as a function of operating hours, integration risk with legacy systems, the cost of capital in the project’s specific fiscal year, and the salvage value of the equipment at the end of its useful life. These are not details; they are the actual terms of the decision the audience came to make. A deck that delivers them cleanly, without asking the committee to hunt for them, earns trust. A deck that treats them as afterthoughts never recovers.
The presentation functions as a logical proof, structured in the exact order the committee runs the calculation themselves. The opening names the constraint. The body models the alternatives. The conclusion states the expected outcome and the conditions required to realize it. That is not a pitch; it is a proposal. And it works precisely because it does not try to be more.
Conclusion
The industrial automation investment deck occupies a strange middle ground: it must feel like a rigorous capital proposal to the finance committee while offering enough engineering credibility to satisfy the plant floor. The winning approach is not to split the difference but to let the payback math do both jobs, grounded in specific utilization scenarios and a named production bottleneck everyone already knows. When the CFO stops checking your model and starts asking questions about timeline integration, you have already cleared the only hurdle that matters.
If you need help creating a winning Supply Chain, Manufacturing & Industrial Decks pitch and would like our presentation specialists’ help, call J.R. for a complimentary discovery and review of your project.
References
-
U.S. Bureau of Labor Statistics
— Job Openings and Labor Turnover Survey (JOLTS) – Manufacturing Sector Data — https://www.bls.gov/jlt/
Grounding the labor cost volatility claim with real churn data that varies by MSA, not national averages. -
Occupational Safety and Health Administration (OSHA)
— Control of Hazardous Energy (Lockout/Tagout) – Standard 29 CFR 1910.147 — https://www.osha.gov/laws-regs/regulations/standardnumber/1910/1910.147
Establishing the regulatory compliance layer that must be factored into any robotics integration timeline and cost model. -
Robotic Industries Association (RIA)
— ANSI/RIA R15.06 – Safety Requirements for Industrial Robots and Robot Systems — https://www.robotics.org/product-catalog/standards
Supporting the claim about safety standards as a cost and timeline variable in automation investment decisions. -
Internal Revenue Service (IRS)
— Advanced Manufacturing Production Credit – Section 45X of the Inflation Reduction Act — https://www.irs.gov/credits-deductions/advanced-manufacturing-production-credit
Providing the real federal subsidy context that changes the competitive payback benchmark for automation investments. -
Manufacturing USA
— Network of Manufacturing Innovation Institutes – Program Overview and Funding Mechanisms — https://www.manufacturingusa.com/
Referencing the co-funded automation trial programs that create alternative benchmarks for payback periods in industrial capex decks. -
U.S. Department of Energy
— Guidance on Scope 1 and 2 Greenhouse Gas Emissions Reporting for Industrial Facilities — https://www.energy.gov/eere/amo/scope-1-and-2-guidance
Adding the emissions reporting pressure from OEMs that affects automation investment justification for downstream compliance reasons. -
Siemens
— SIMATIC S7-1500 PLC Integration with Robotic Systems – Technical Documentation — https://support.industry.siemens.com/
Grounding the claim about PLC integration credibility as a real technical hurdle in automation pitches.
Written By Presentation Gurus

Creative Director
J.R. founded Presentation Gurus in 1997, growing a marketing side hustle into a global studio serving startups, investors, and Fortune 500s. With three decades of experience, he personally leads every project as the client contact. He applies this same narrative-first process—honed across thousands of pitches—to every article, guide, and case study. Learn More
More Pitch Deck Breakdowns

The Manufacturing Capability Pitch: Winning Contracts When Your Factory Floor Is the Only Slide That Matters
Read the breakdown →
The Private-Label / OEM Manufacturing Pitch: When Your Customer Is Also Your Gatekeeper
Read the breakdown →
The Commercial Leasing / Tenant Pitch: Why Your Leasing Deck Needs to Sell Occupancy Before Square Footage
Read the breakdown →